Perspective BFA
Developing a virtual exhibition hosting the works of 14 graduating senior graphic designers.
Florida Atlantic University’s BFA Graphic Design program hosts an annual senior portfolio exhibition for graphic design students. In order to promote the upcoming exhibit, senior students are asked to design a postcard as a class assignment. One student’s design is chosen by the graduating class, and their design goes into production.
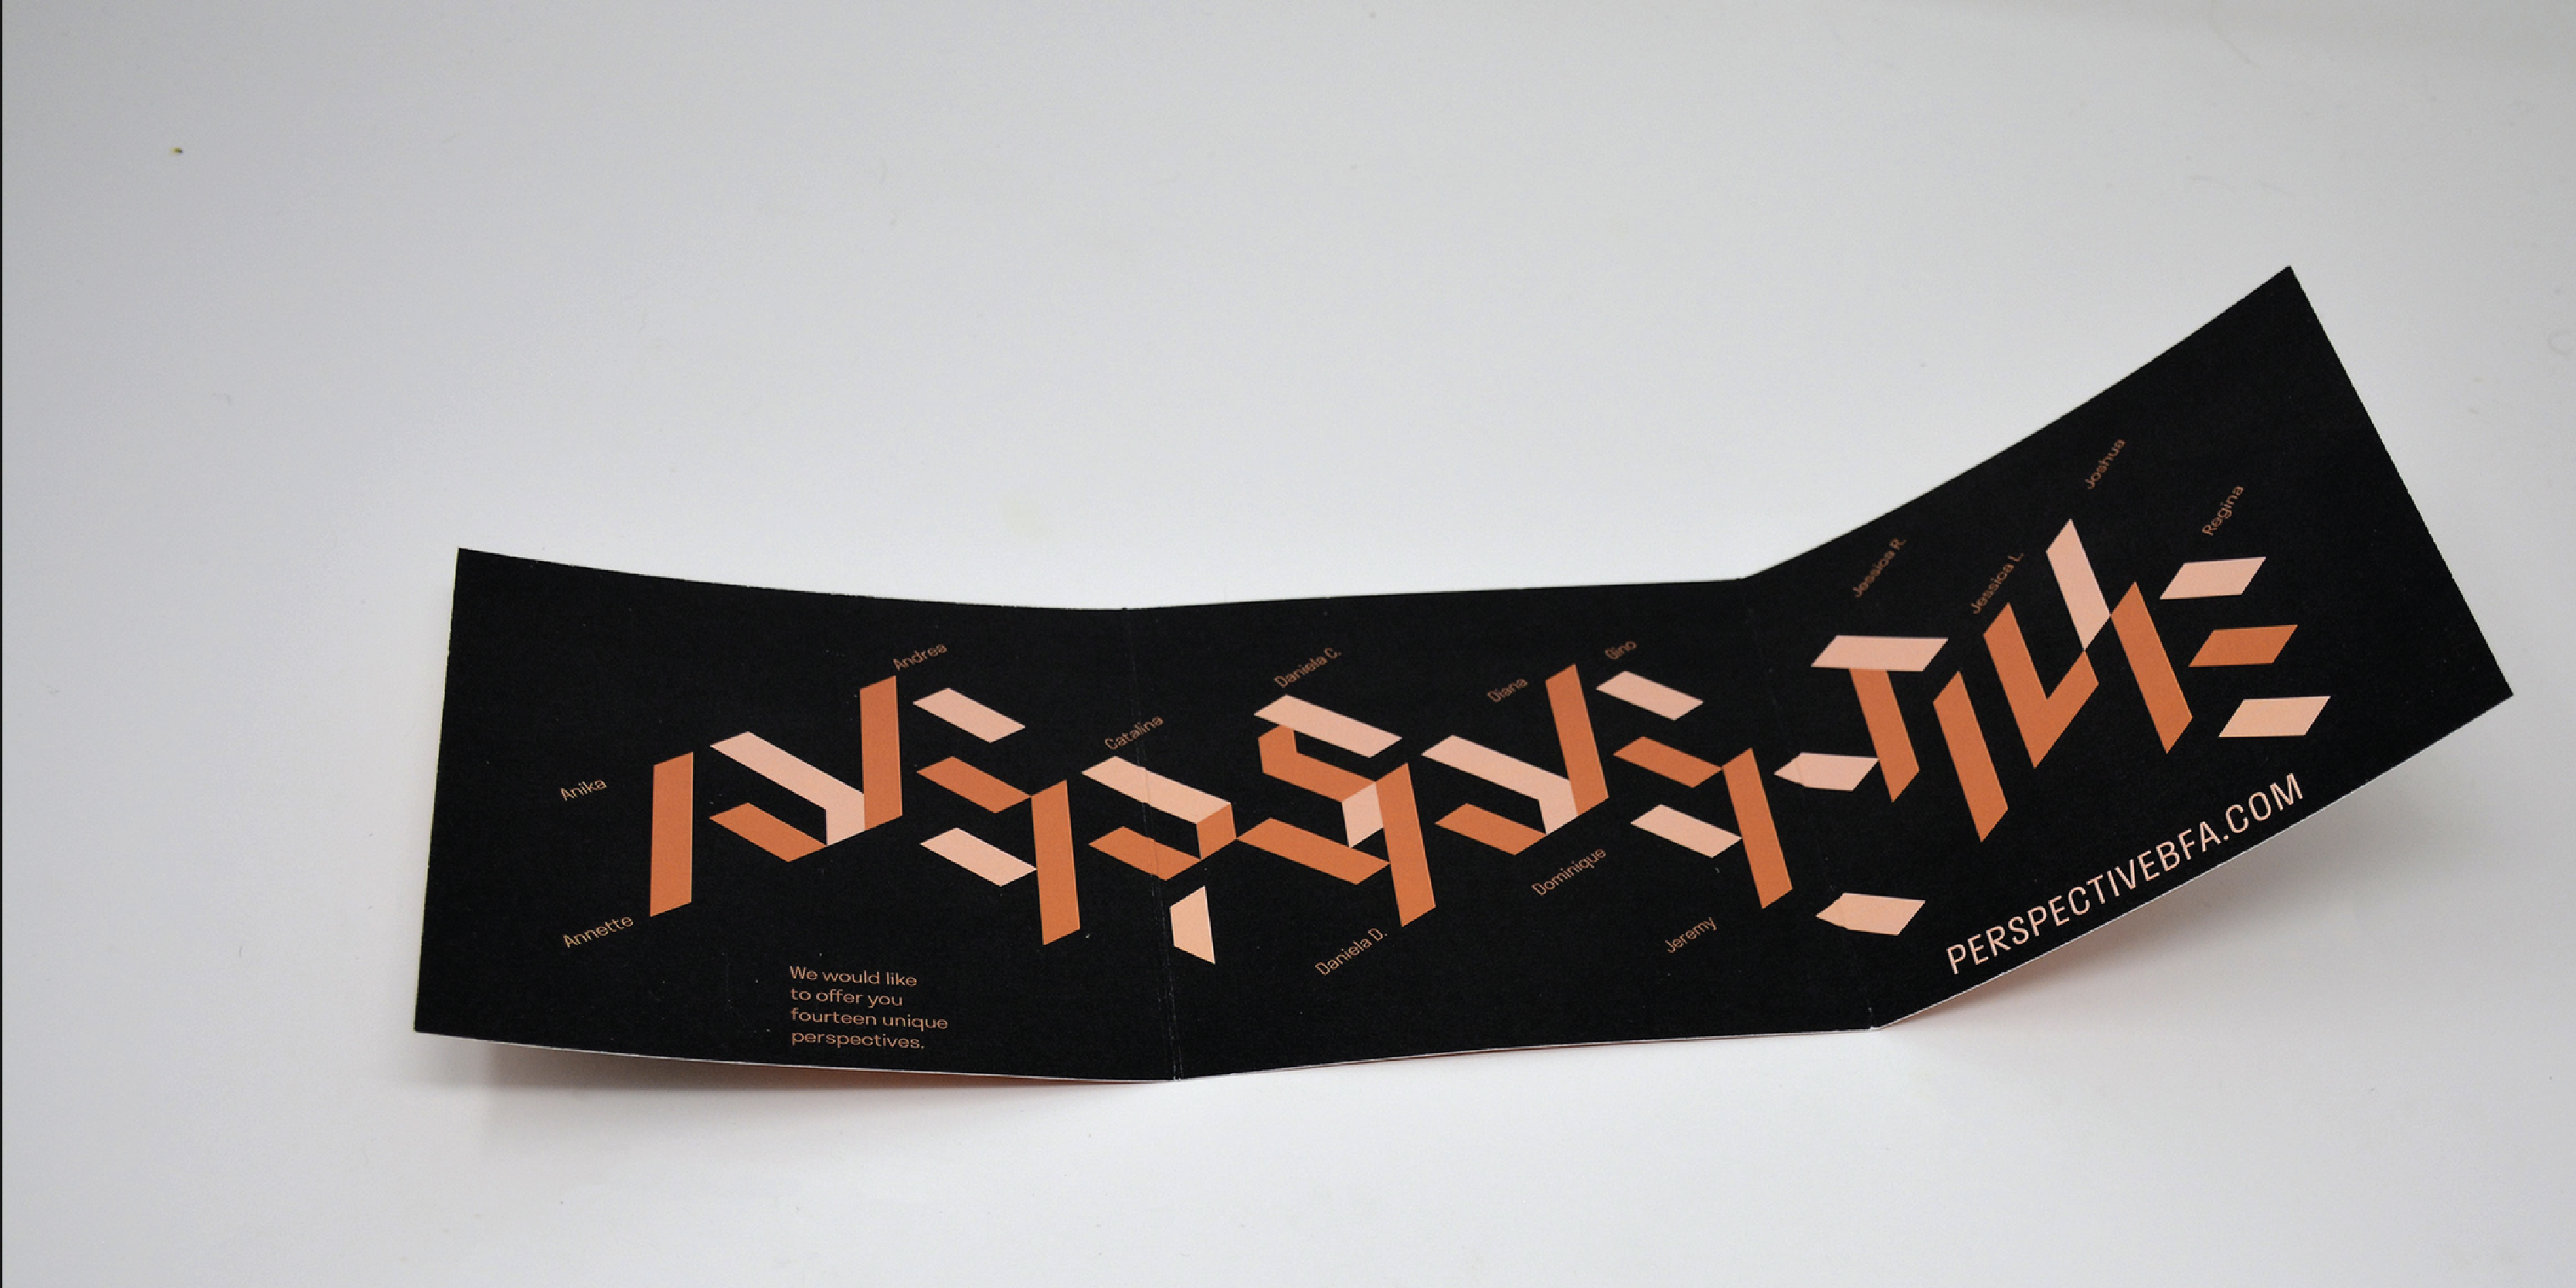
For my graduating class this design, created by Gino Castellanos, established the design system of our online exhibition that I had the great opportunity of developing alongside fellow senior designer, Joshua Nolan.
Deliverables
- UML for PerspectiveBFA.com
- A countdown mechanism for the anticipation of the upcoming launch date
- A portal for designers to input and consolidate their page information
- Deploy a website that hosts a virtual exhibition, showcasing the works of 14 graduating designers, and leads traffic to their individual portfolios.
UML
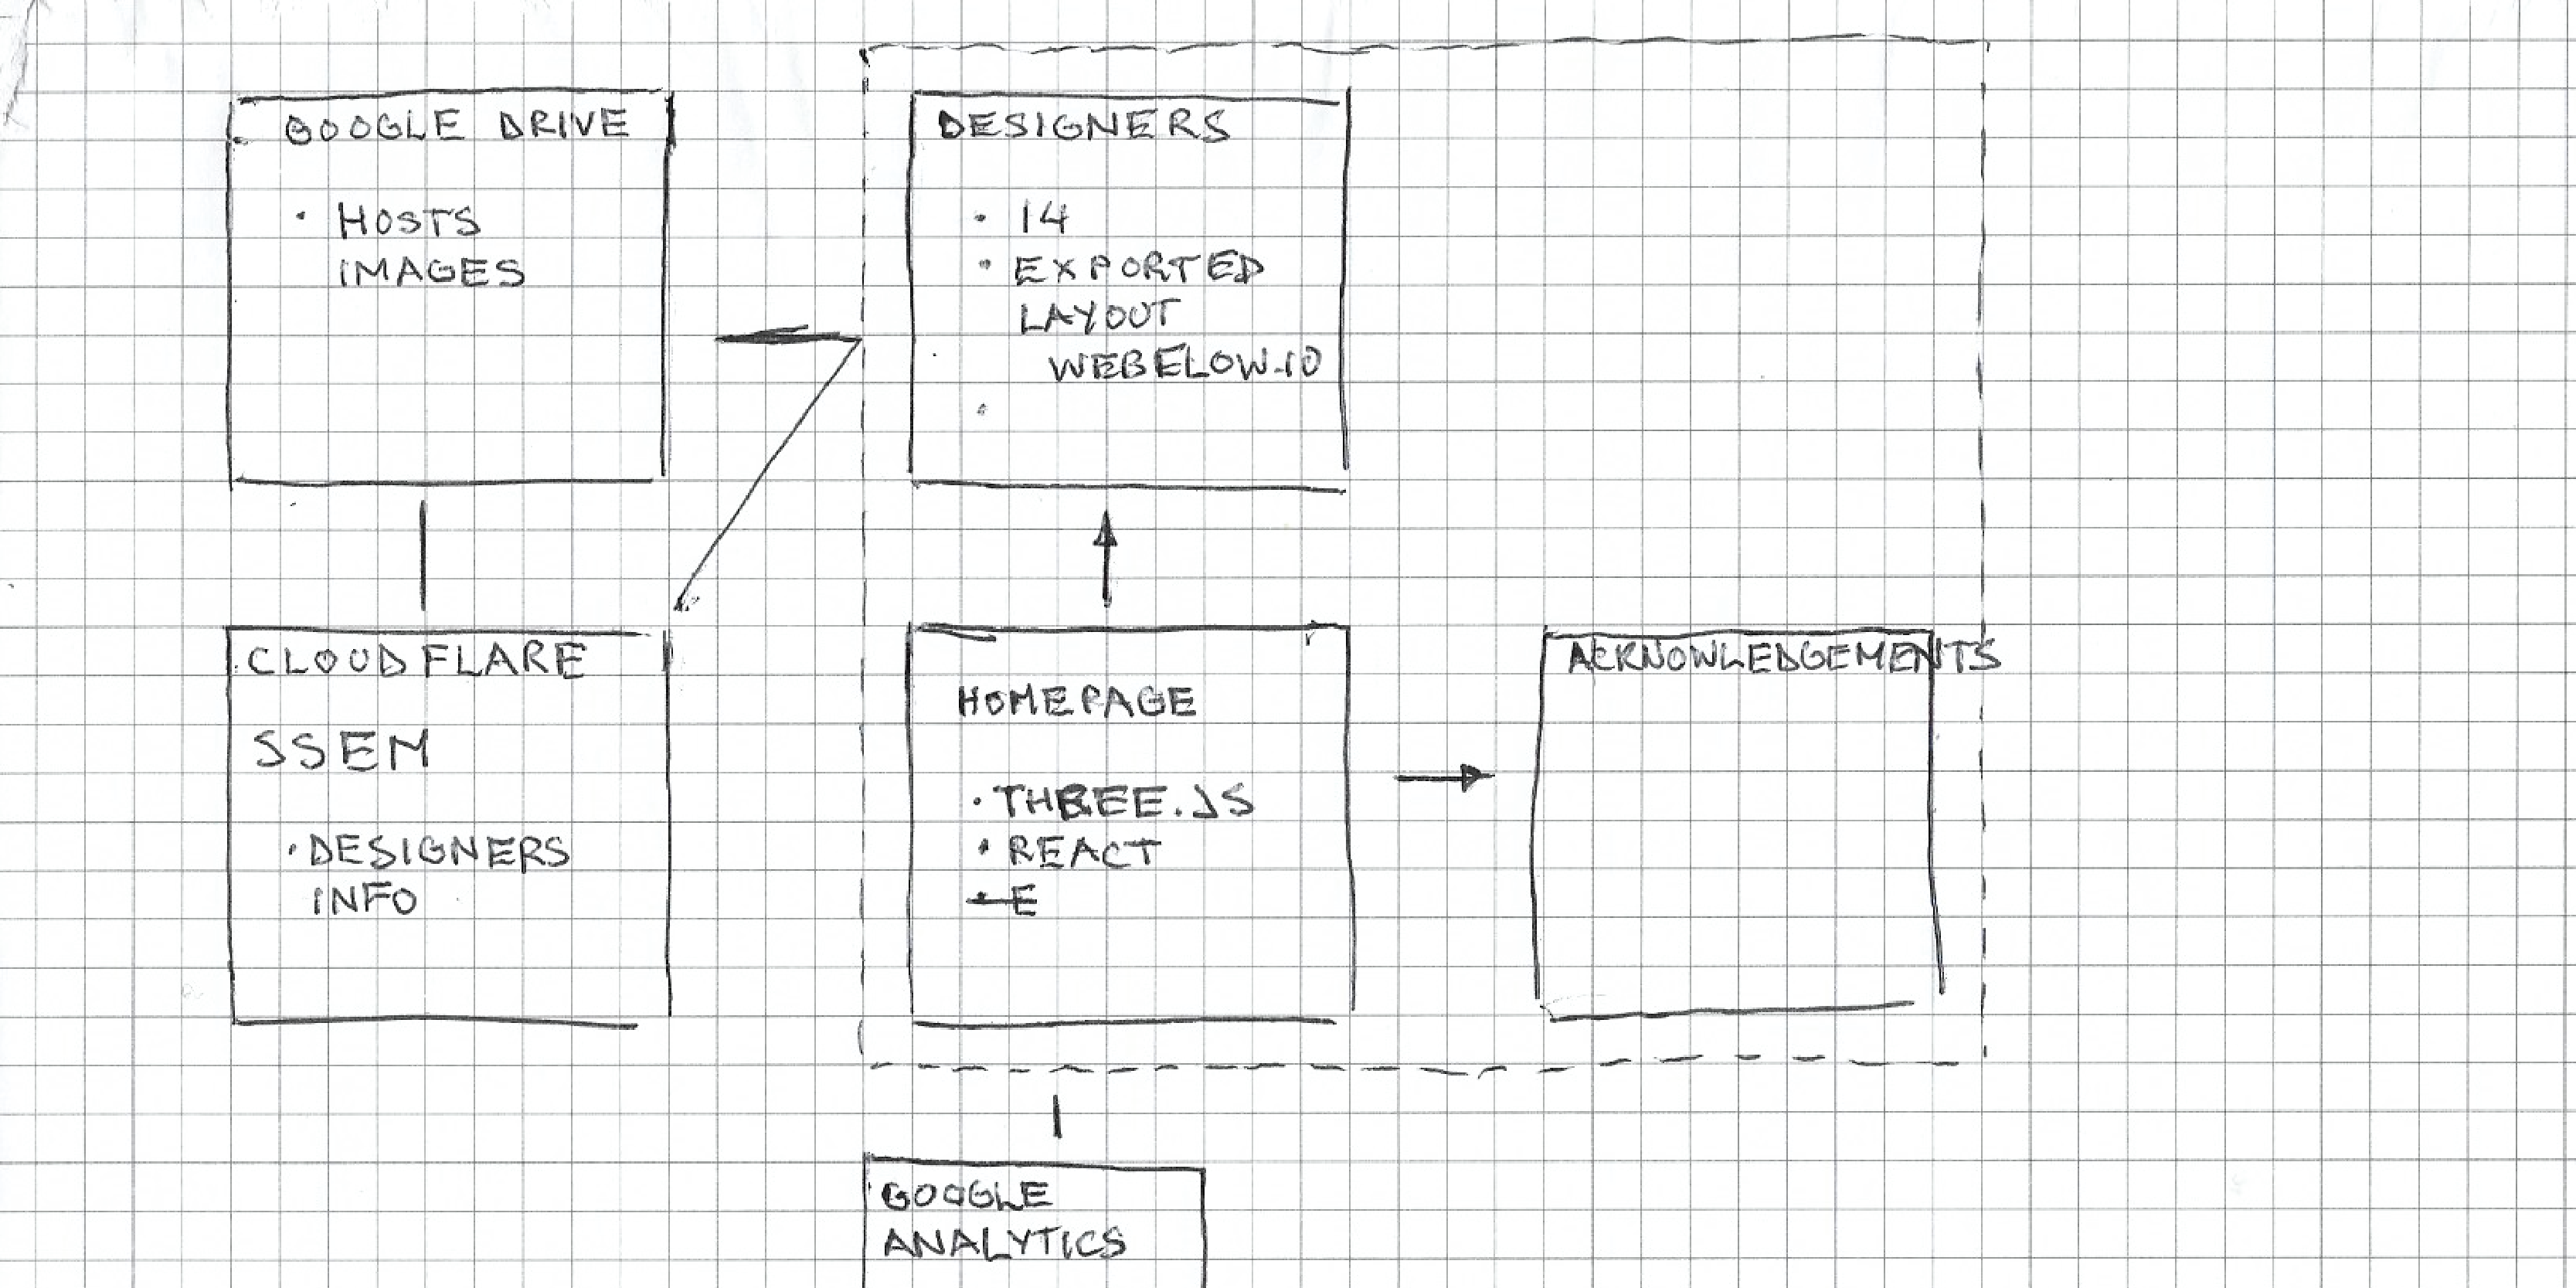
My teammate did the preliminary work of creating the layout and structure of the site using a combination of Adobe Illustrator for our first iteration and webflow for the second iteration.
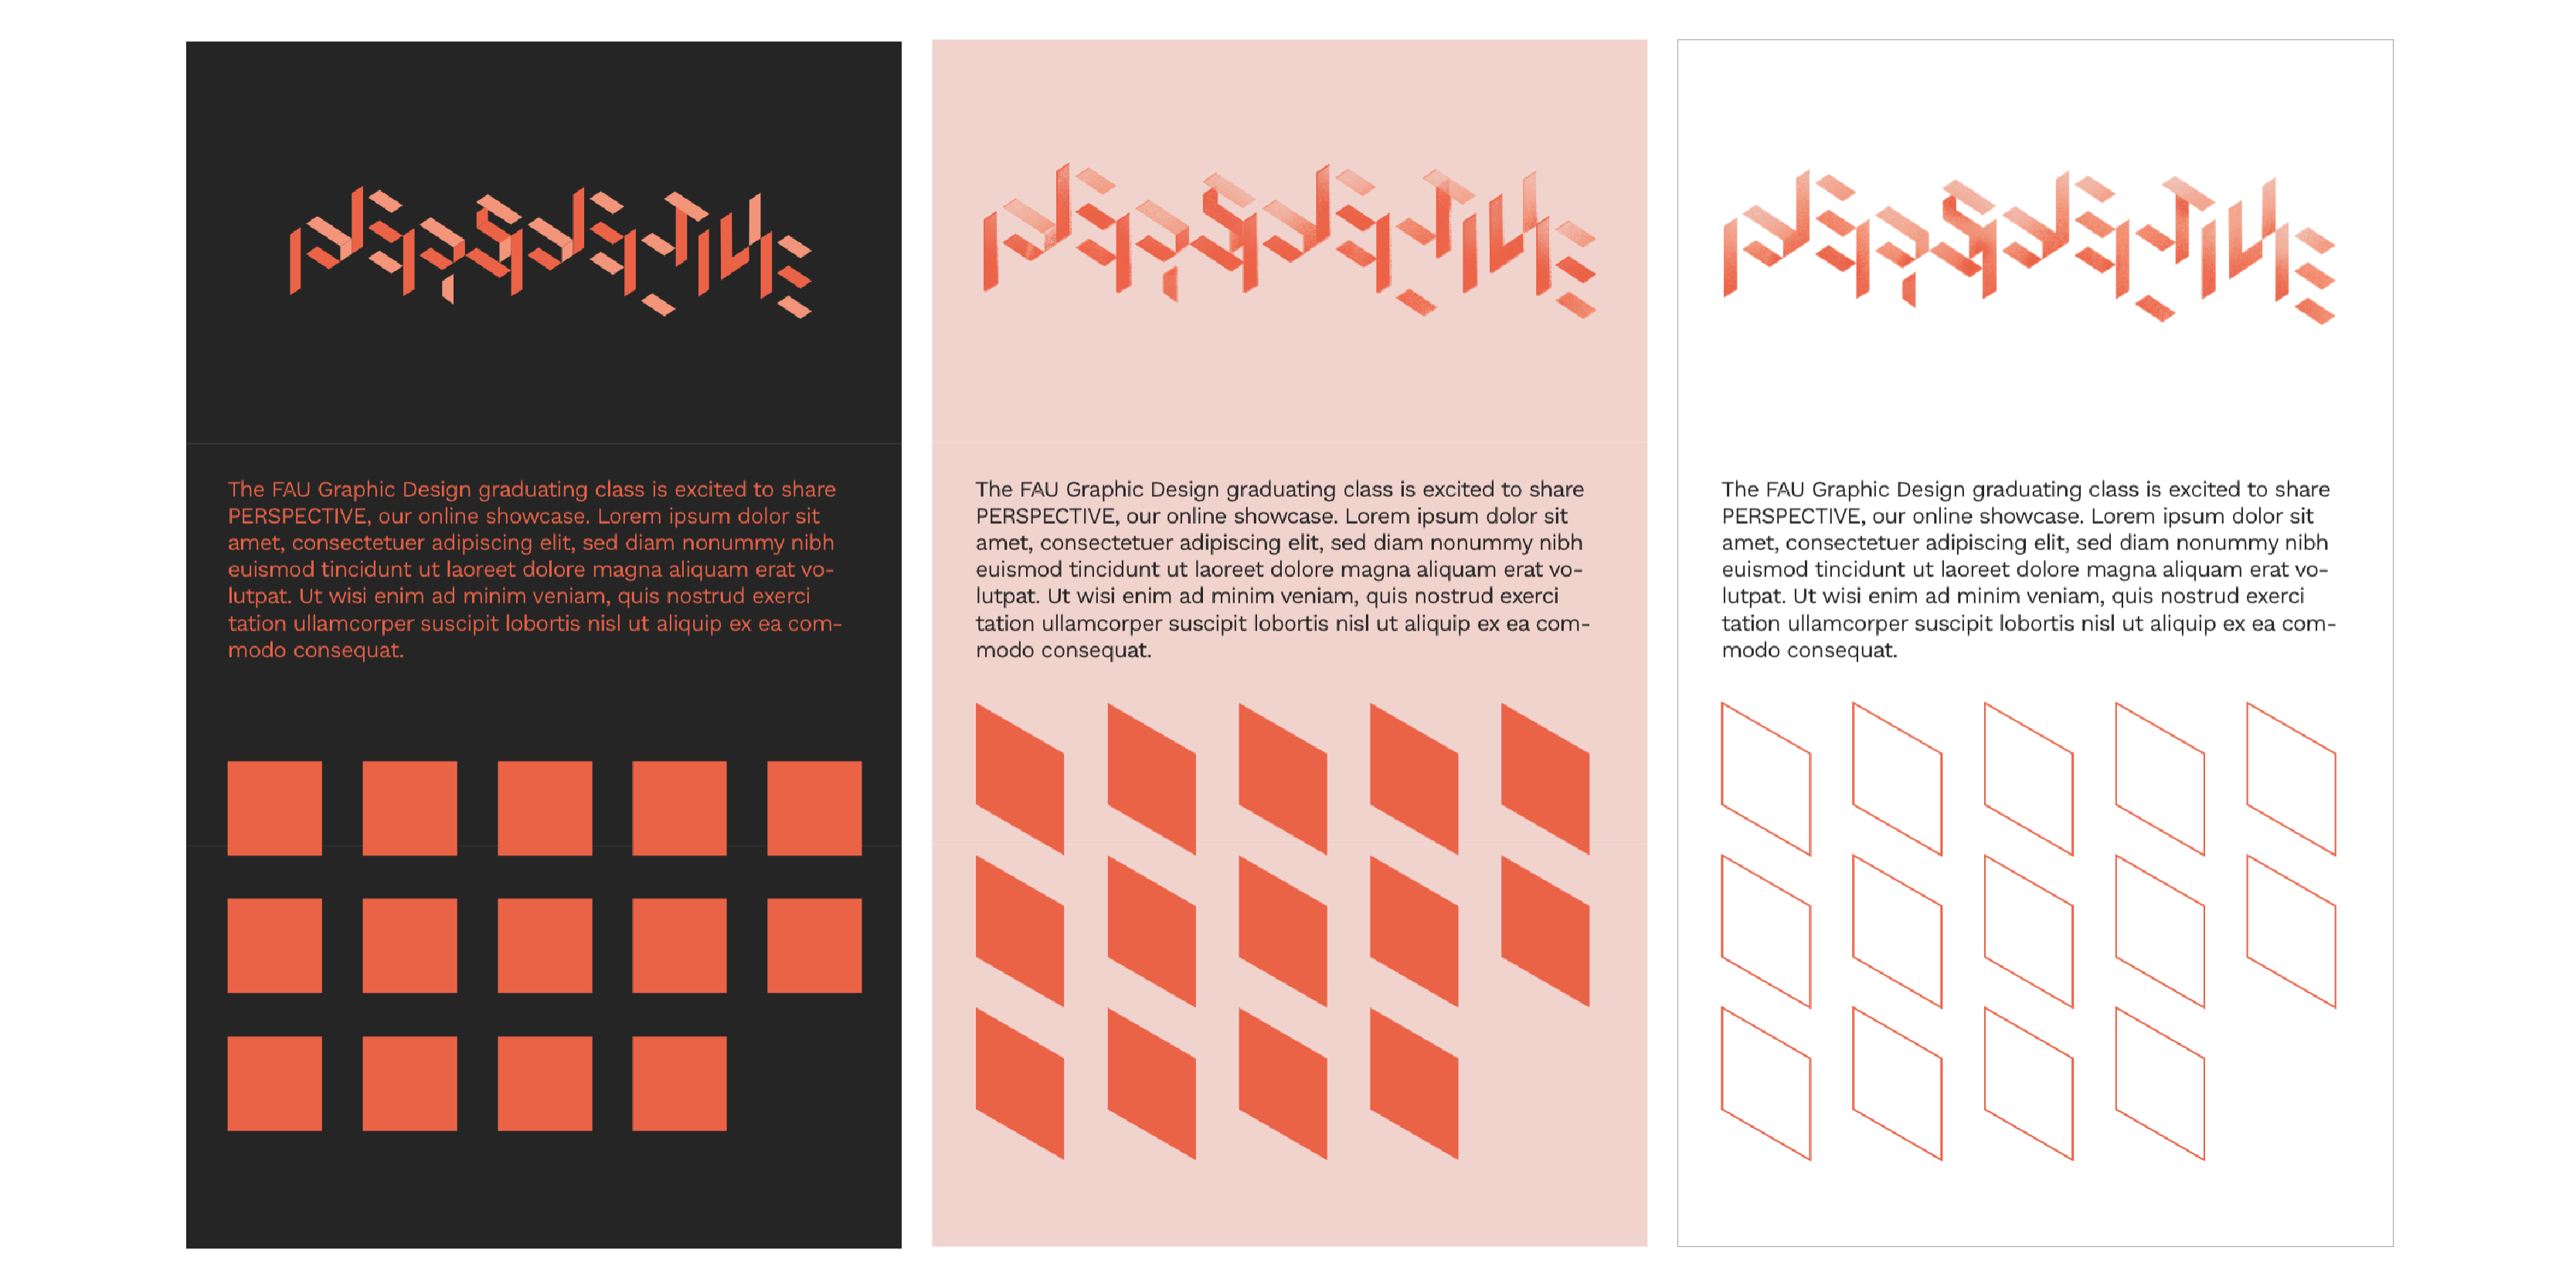
I then built upon those visions, exporting the html/css from webflow and converting it to javascript, in order to work with the React framework. This decision was made in order to allow for a dynamic landing page and to enable the capabilities of utilizing React components. For the landing page, I used a javascript library called three.js for the interactive geometric experience.
Countdown
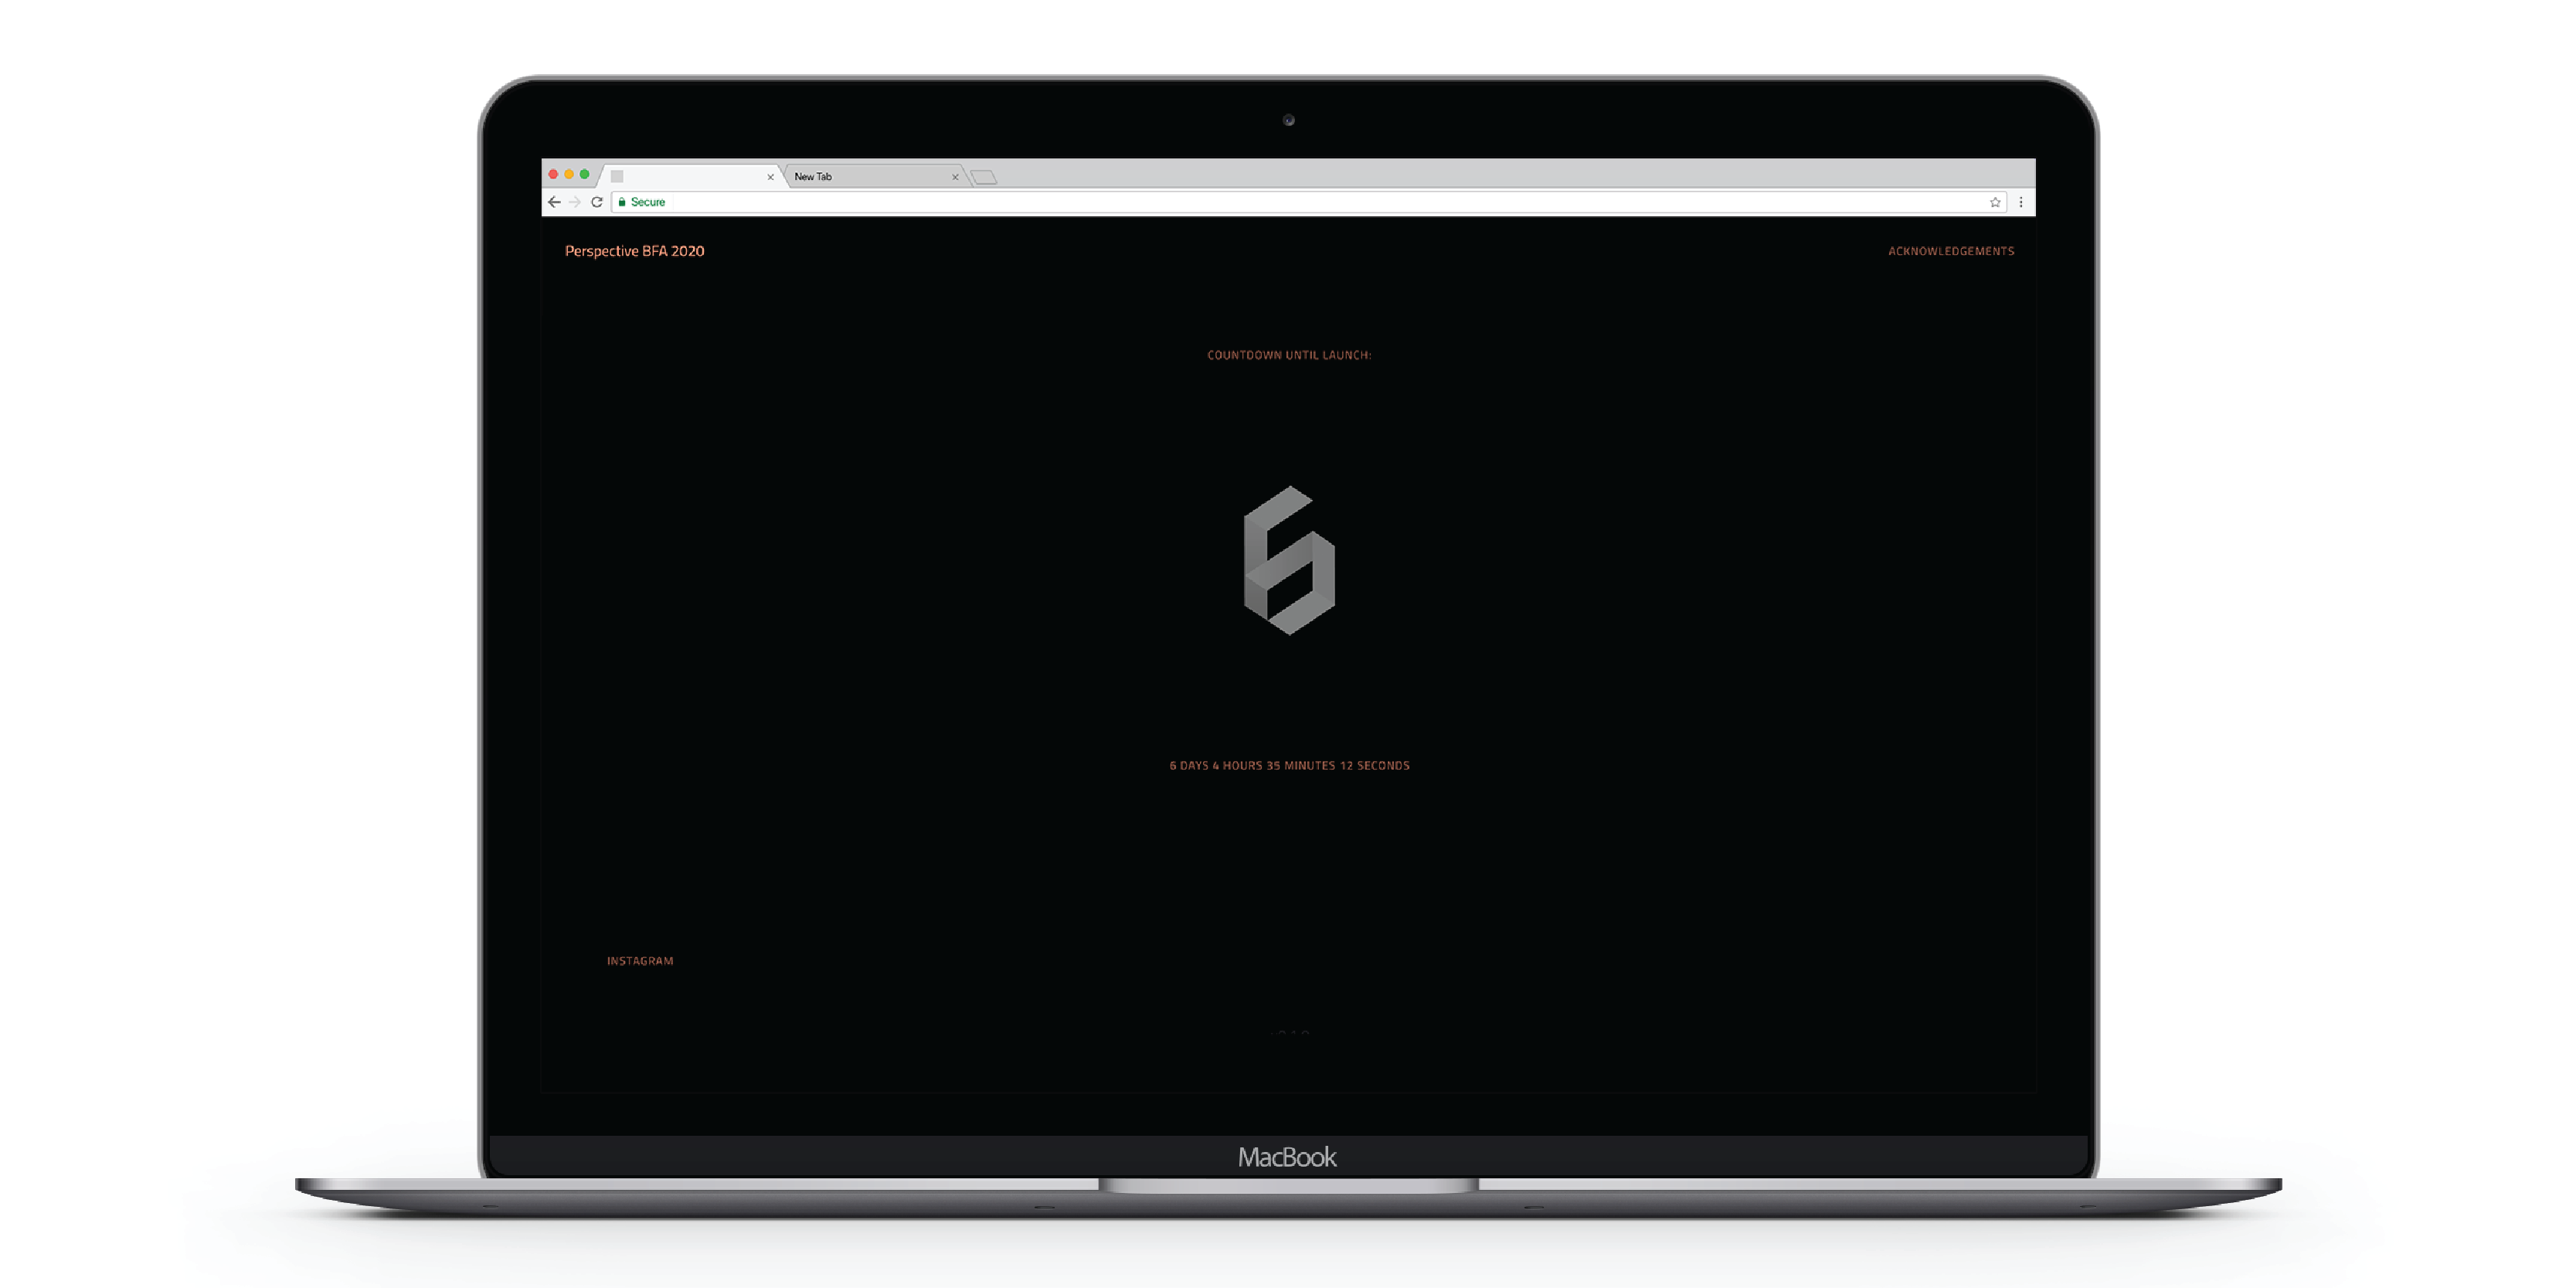
For the week prior to the deployment of our exhibition, I created a live countdown with the days, hours, minutes and seconds left until launch.


PERSPECTIVEBFA DOT COM
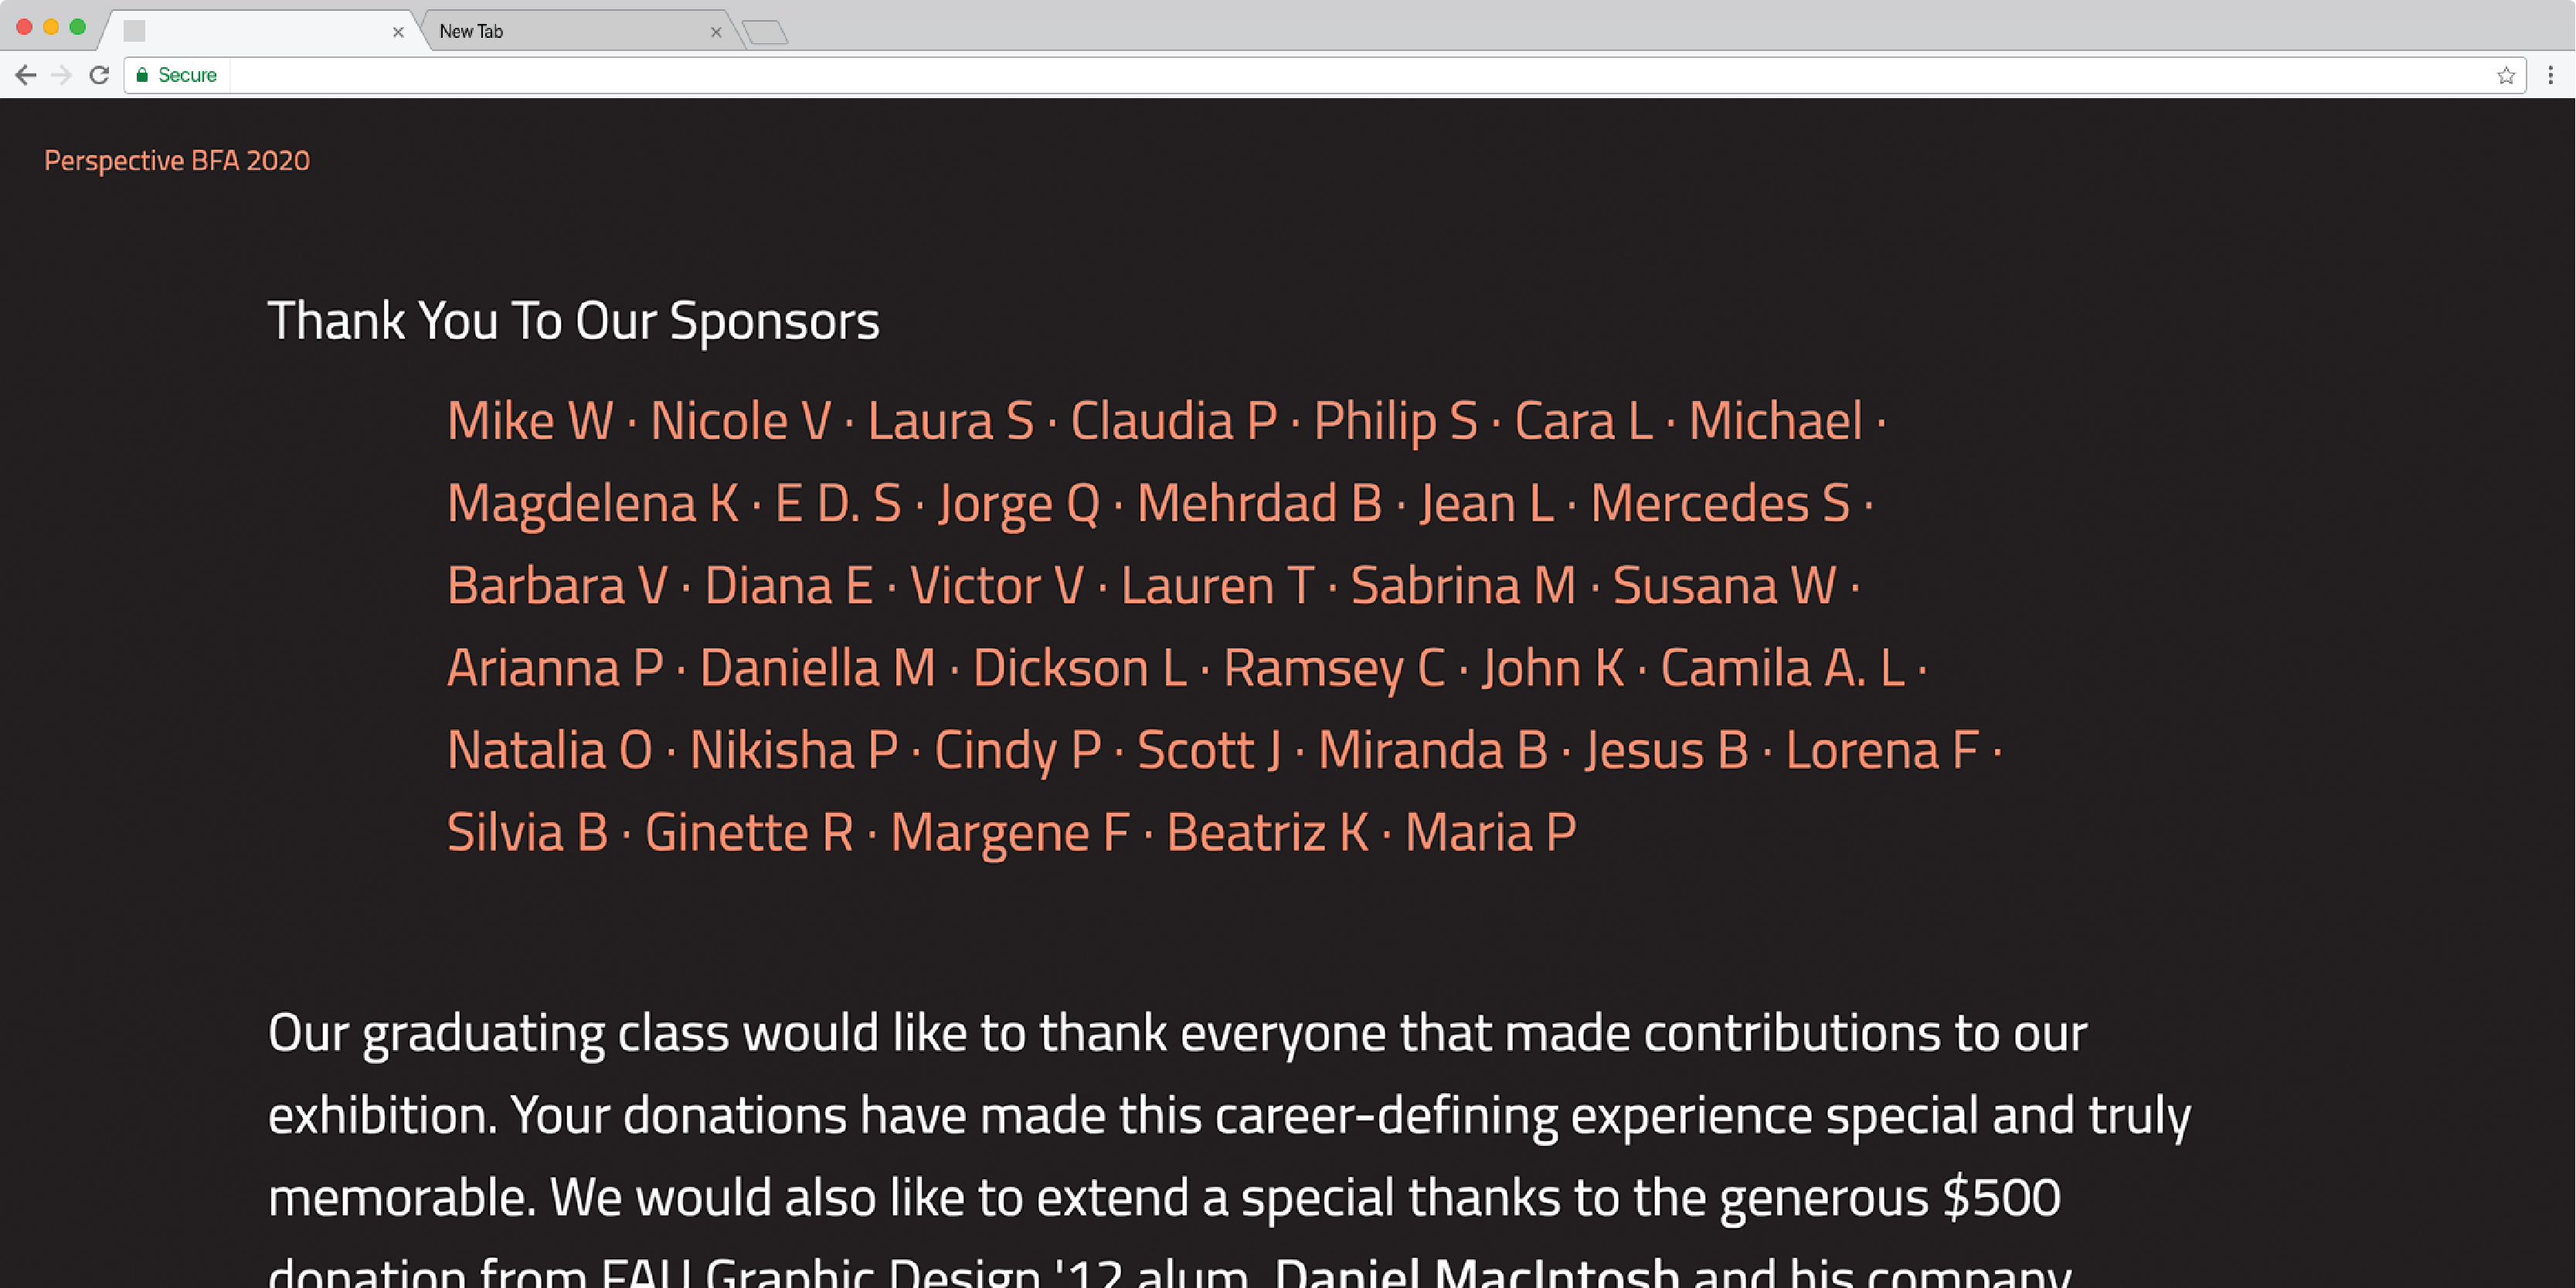
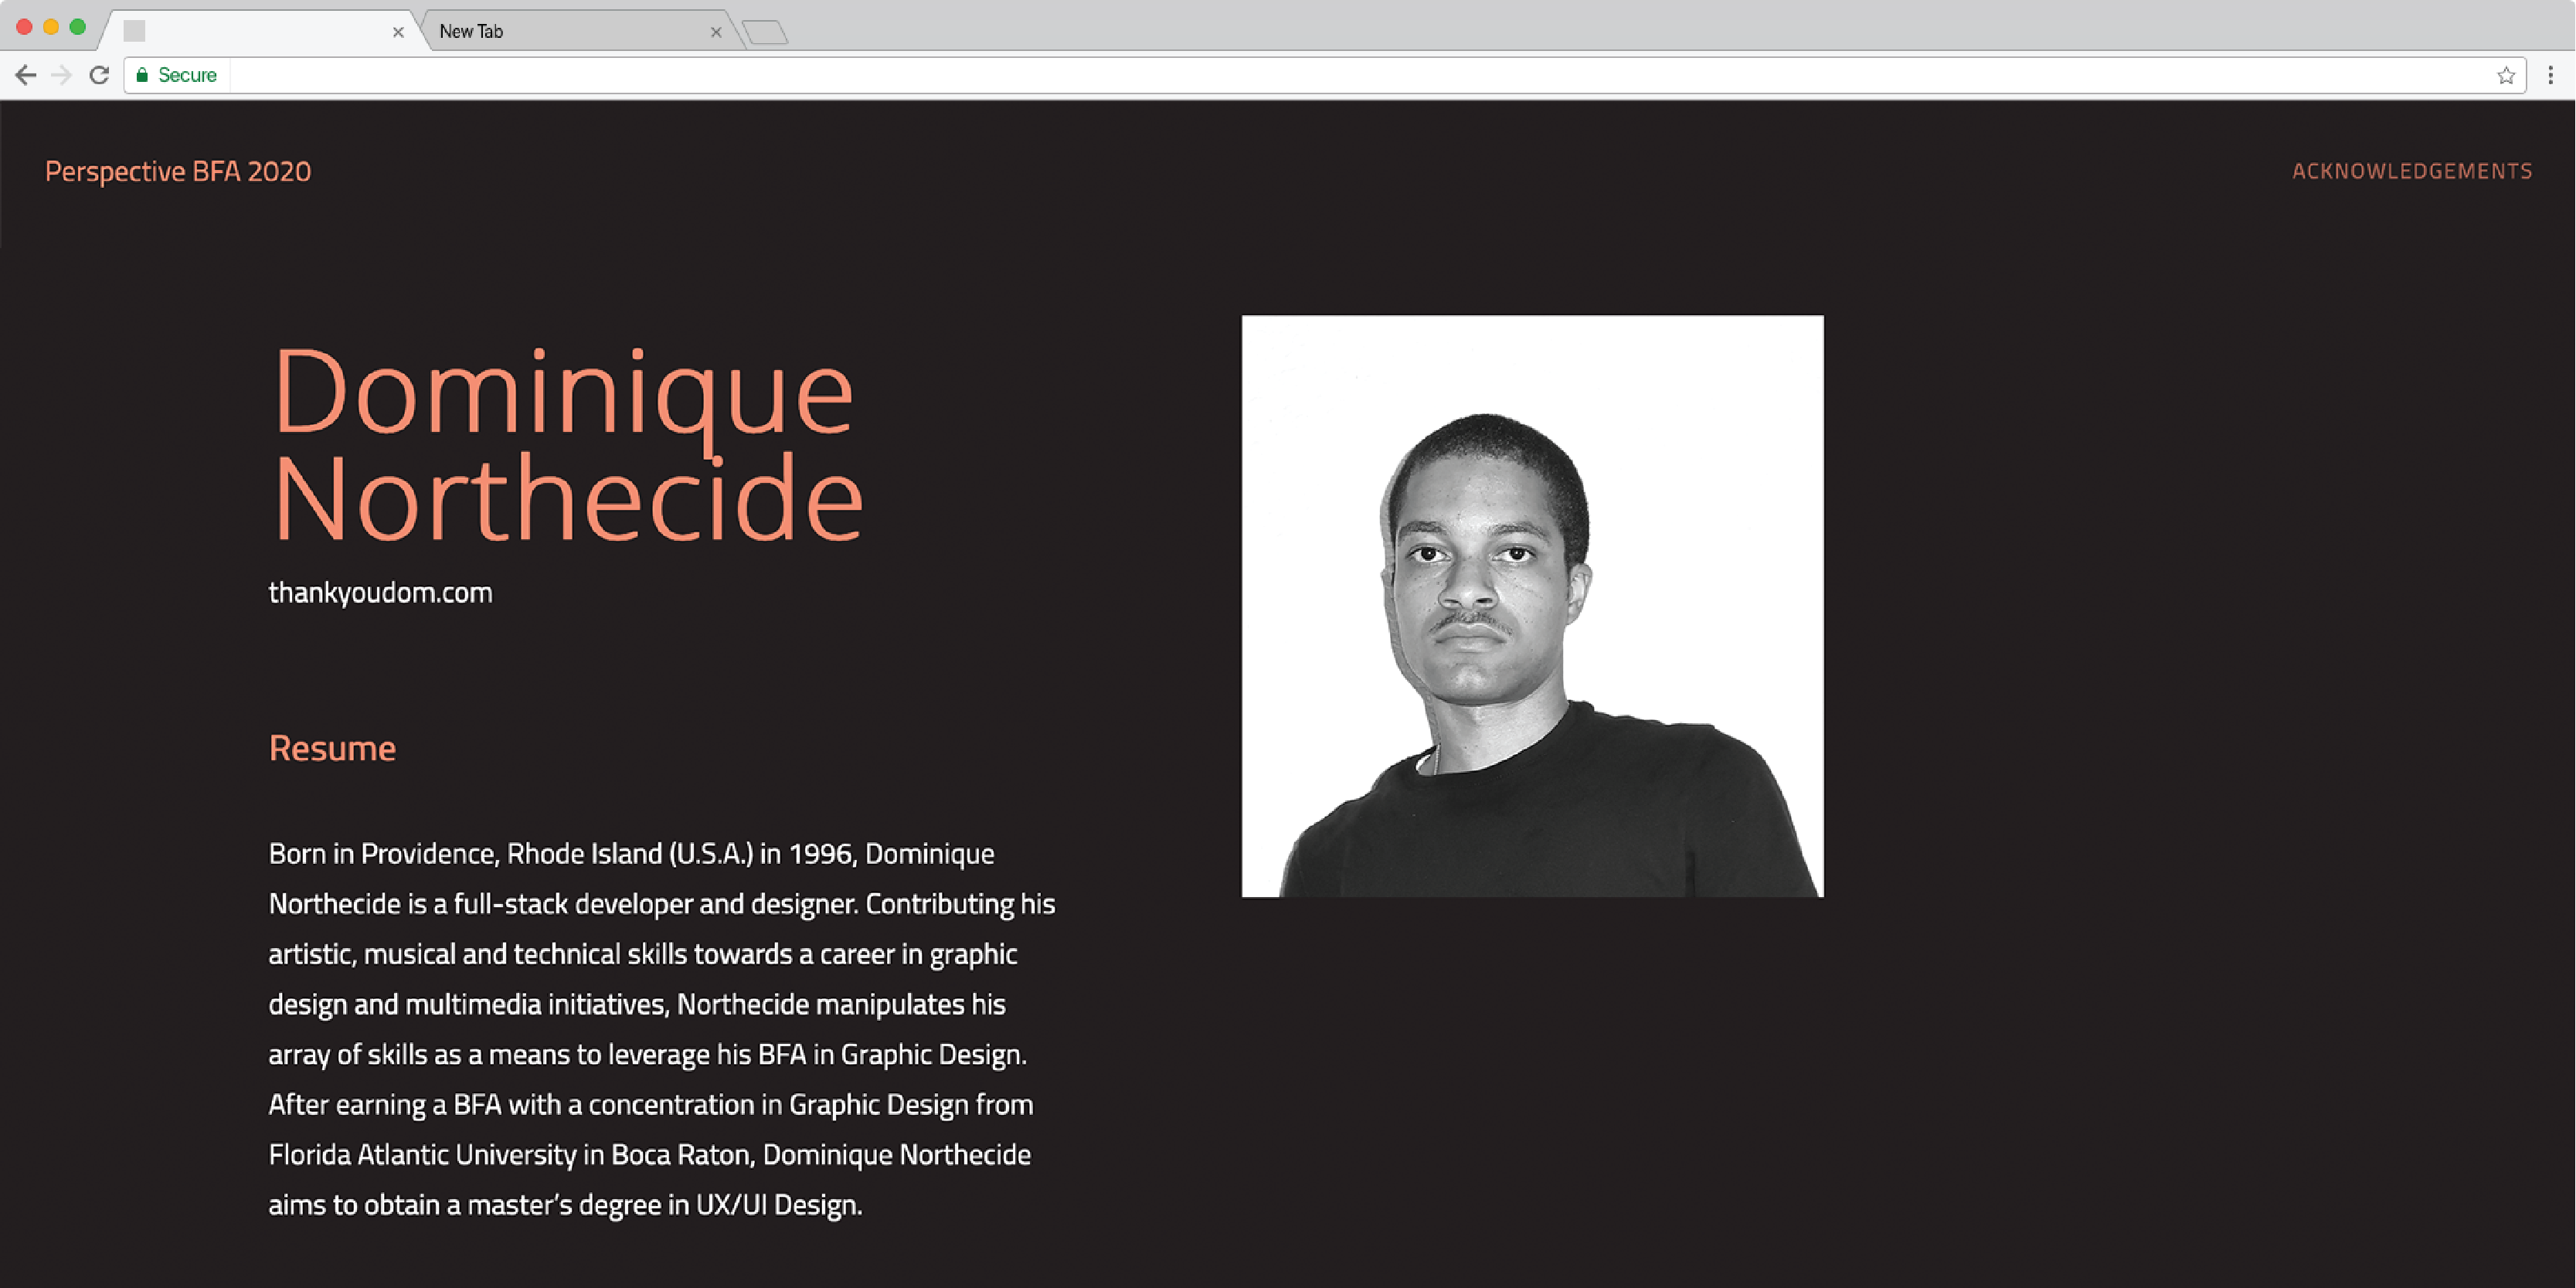
As the nation transitioned to remote learning and digital communication, this online exhibition refocused our energies towards creating designs for digital platforms. Three of these works were selected, per designer, for our individual pages that hosted our resumes, a brief paragraph about the designer and a link to each designer’s personal portfolio site.
Online Presence
Congratulatiions to my teammates for an excellent school year, here’s our exhibition. You’ll notice that the design decisions of the site were informed by the design system of the invitation.
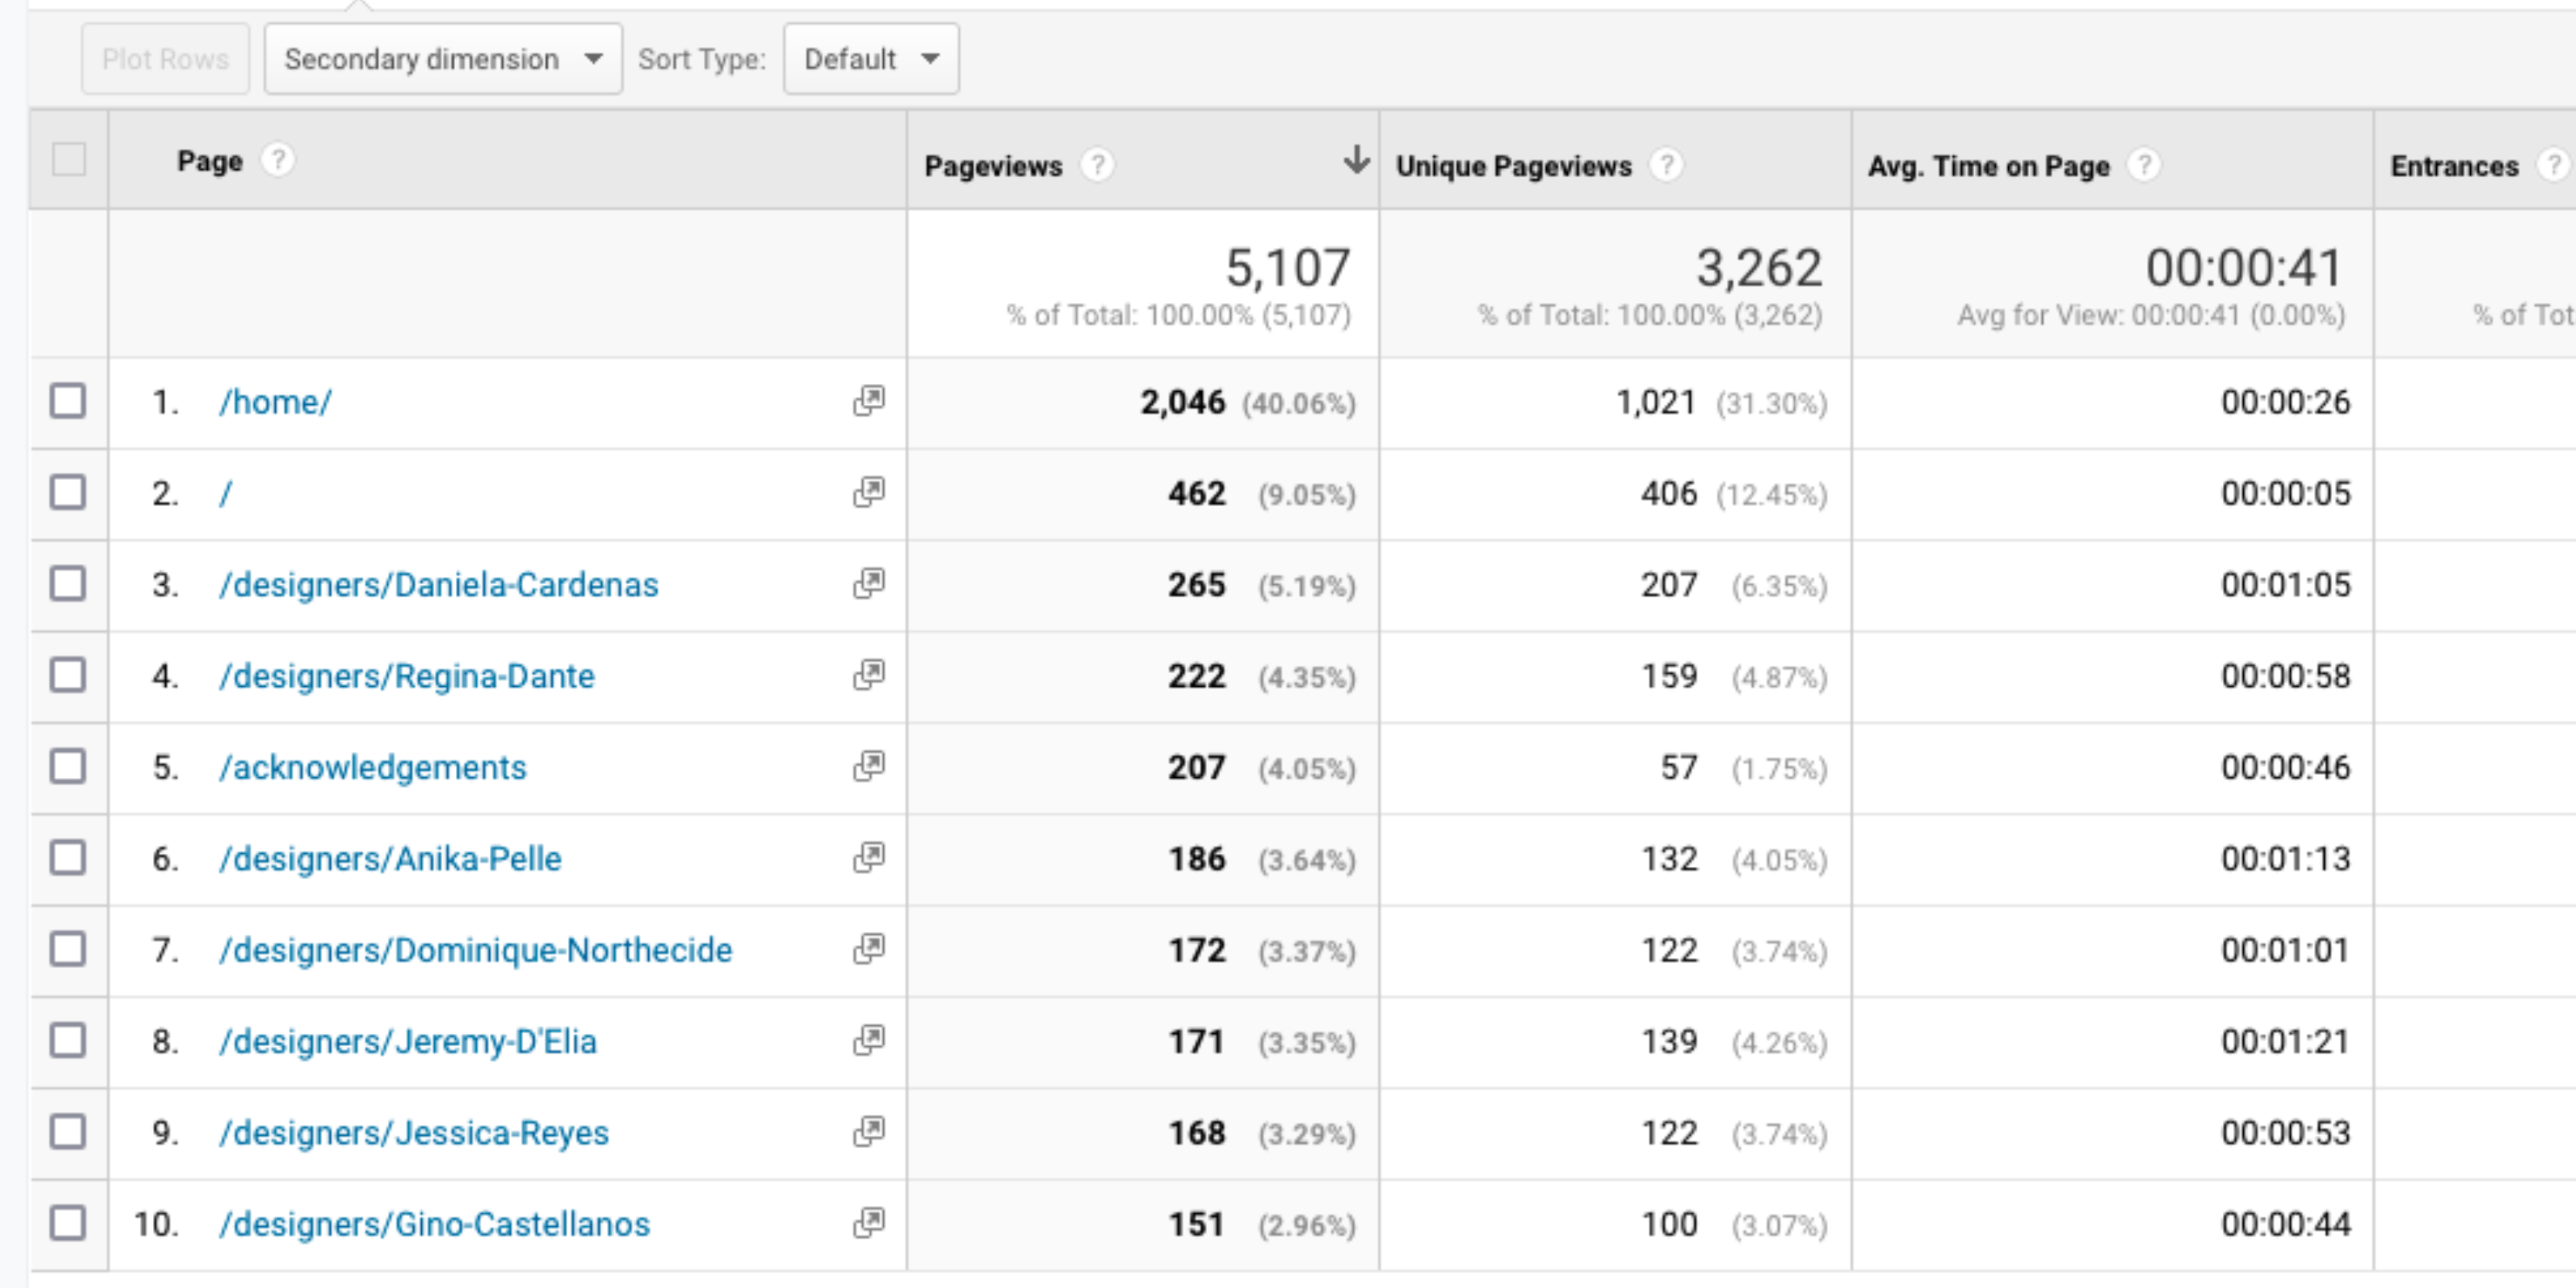
The image above is a screenshot from Google Analytics, displaying the performance metrics of various pages from our exhibition. The table includes data for pageviews, unique pageviews, average time on page, and entrances for each listed page. Key points are:
- The homepage has the highest number of pageviews (2,046), unique pageviews (1,021), and an average time on page of 26 seconds.
- The second-most visited page, indicated by a “/” (homepage), has 462 pageviews, 406 unique pageviews, and an average time on page of 5 seconds.
- Several designer profile pages show a range of pageviews (from 151 to 265), unique pageviews (from 100 to 207), and average times on page (ranging from 4. 4 seconds to 1 minute and 21 seconds).
- The acknowledgements page has 207 pageviews, 57 unique pageviews, and an average time on page of 46 seconds.
Overall, this data highlights the distribution of user engagement across different sections of our exhibition.